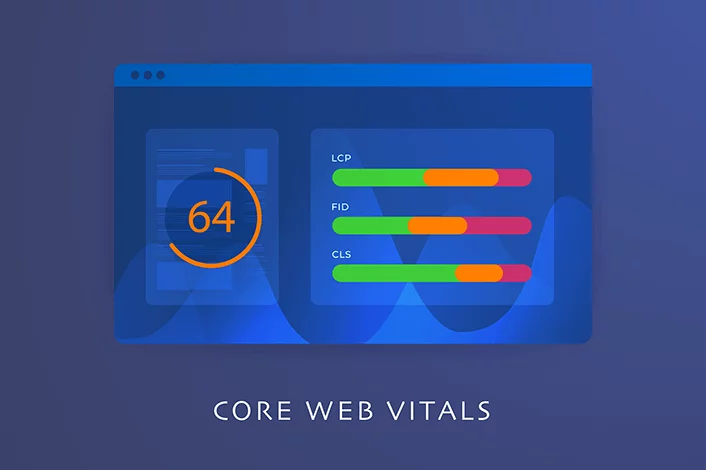
Google announced new Core Web Vitals in May 2020, and the update began rolling out in mid-June 2021.
Google Core Web Vitals are a set of measurable SEO performance metrics that measure your website’s user experience (UX). Google provides specific and measurable data points that will ensure users have a seamless and smooth experience when interacting with your website. This way, they’re more likely to return.
Why focus on user experience?
Bad user experience is a significant cause of high bounce rates.
88% of online shoppers won’t return to a website after a bad user experience, and 75% of people decide on a website’s credibility based on aesthetics. It is no wonder, therefore, that 70% of online businesses fail because of bad usability!
To help businesses reduce bounce rate and effectively track and measure user experience, Google outlined three new Web Core Vitals, as followed.
- Largest Contentful Paint (LCP)- This measures the average load time of the main content on a webpage.
- First Input Delay (FID)- This measures the time taken from the time a user inputs a command to the time it is executed (interactivity).
- Cumulative Layout Shift (CLS)- This measures your website’s stability when loading (visual stability)
Let’s discuss these in detail.
Core Web Vitals And How To Optimize Them
Google is a search engine matching a user’s query with the most relevant results. Google takes this process beyond matching high-quality content with search intent. It also ensures that the user has a seamless experience.
So, Google furthermore audits websites for safe browsing, mobile-friendliness, and other basic experience signals. But, the search engine makes it mandatory for websites to offer a certain level of user experience by setting Core Web Vitals. Websites that fail to comply are given lower ranking scores than those that do.
What are Core Web Vitals?
Core Web Vitals are elements of a website that cumulatively affect UX. The Core Web Vitals report is based on elements such as real-world usage data, URL groups (groups of similar web pages), URL status, and URL metric type.
How are Core Web Vitals Report scored?
The report only includes results for indexed URLs. Indexed URLs are pages that can appear in Google search results and are found with enough quality for relevant search phrases.
The Core Web Vitals reports will essentially analyze three aspects of your website. Loading, interactivity, and stability.
Here’s how to optimize for them.
Loading: Largest Contentful Paint (LCP)
Largest Contentful Paint (LCP) is a metric used to measure the time taken for a website to show users the largest content on the screen, completely loaded and ready for interaction.
LCP typically measures elements such as background images, video poster images, images, and block text-level elements, including paragraph tags. Not all elements are used to measure LCP, however. Exemptions include video and SVG elements.
According to Google, this metric considers everything seen on a webpage without scrolling.
How LCP Is Measured
You can use the field method or lab tools.
Commonly recommended lab tools include WebPageTest, Chrome DevTools, and Lighthouse. Field method (uses real-world usage data, also known as field data) includes PageSpeed Insights, Search Console (core web vitals report), or Chrome User Experience Report.
What Is A Good LCP Score?
Google has set LCP scores as follows:
- Below 2.5 seconds = Good
- Between 2.5 seconds and 4.0 seconds= Needs improvement
- Above 4.0 seconds= Poor
Source: Rockcontent
User Reaction To Load Time
Google is right to set the rating for a good LCP at 2.5 seconds because the limit for users is 3 seconds!
It is reported that 40% of website visitors will leave if the load time is more than 3 seconds. 53% of mobile visitors will leave a page that takes more than 3 seconds to load.
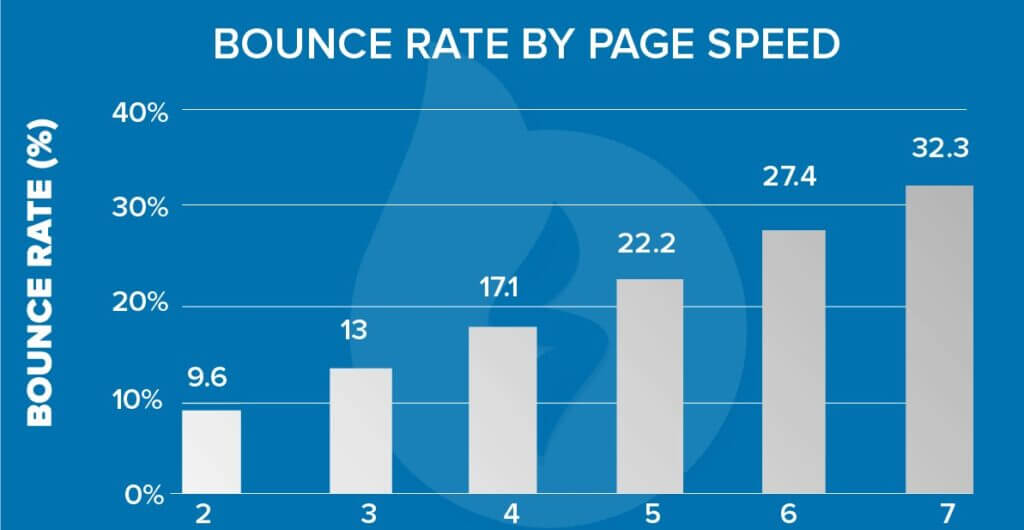
Source: Speedy Site
Additionally, 39% of site visitors will stop engaging with your content if images won’t load or take too long to load.
Despite this, GTmetrics reports that the average page load time in 2021 is 7.2 seconds. Although this seems comforting, it is scary when we look at the numbers.
According to Neil Patel, a one-second delay when loading a page results in a 7% conversion reduction. This means that if your business is making $100,000 daily, it could potentially lose $2.5 million in sales annually.
What if we decreased load time?
A case study from Mobify revealed the following:
Every 100ms decrease in homepage load speed resulted in a 1.11% lift in session-based conversion. As a result, the average annual revenue increased by $376,789. Correspondingly, a 100ms decrease in checkout page load speed led to a 1.55% increase in conversion. The annual revenue, therefore, increased by $526,147.
Now, let’s look at seven techniques you can use to improve your page load time significantly.
How to Reduce Page Load Time
1. Use a CDN
Content Distribution Networks (CDNs) are a network of servers that are geographically distributed around the world, saving copies of your website in multiple locations. This allows your website’s users to load content faster, thanks to the bandwidth that has been distributed across multiple servers.
2. Allow File Compression and Minify JavaScript, CSS, and HTML
Use data compression programs to reduce your CSS, JavaScript, and HTML files that are larger than 150 bytes. This technique also reduces download time.
Additionally, review your code and remove any unnecessary characters, spaces, and commas. This is known as minification. Google shares insightful minify resources.
3. Reduce Redirects
The more redirects, the more server requests are made, slowing down a page. Review your pages to ensure that links go to the final destination instead of linking to a Uniform Resource Locator (URL) that will lead to the final destination.
4. Optimize your visual content, including images and videos
Images and videos have become an essential part of a webpage, especially because of the significance of visual content marketing.
BuzzSumo analyzed over 1 million articles and found that those with an image every 75-100 words had double social media shares as those with fewer images.
A different report shows that visuals can potentially increase engagement by 80%, and blog posts with images have 650% higher engagement than those pages without images.
Consequently, most web pages are 43% made up of images. You, therefore, need to ensure that images are optimized to occupy the least space possible while retaining quality.
To do this, use the right image file type for the required purpose.
- JPGs have a small file size, working better with images with several colors, such as photographs.
- PNGs have larger file sizes than JPGs, but are of higher quality, making them ideal for text-focused graphics such as infographics, posters, etc.
- GIFs are best for animated images.
Alternatively, your web designer can use lazy loading, a technique that allows images to delay loading until they are visible on the screen. Image optimization tools are also an option.
5. Invest in a good hosting solution
Cutting operational costs is good for business but very costly when executed on the wrong item or element. You should never compromise on hosting services!
Cheap hosting is a double-edged sword. Reducing operational costs but losing you revenue through reduced page load speeds.
How?
Cheap hosting results in poor performance because you are forced to share resources with multiple websites, usually on an overloaded server. This significantly reduces your page load time, and Neil Patel’s example is a yardstick on losses to expect.
Instead, invest in a performance-focused hosting solution that is cloud-based hosting for the fastest delivery or even a dedicated server which is an upgrade from shared servers. These platforms have quality servers and bandwidths designed for performance.
And yes, these providers don’t offer shared hosting!
6. Embrace Caching
Cache is a software or hardware component that stores data to ensure that future requests for that same data are served faster.
This technique is one of the most effective ways to decrease page load speed by specifically lowering Time to First Byte (TTFB).
Caching can be done in two main ways.
- Browser caching- The browser is able to store different data, such as JavaScript files and images, to avoid reloading the page every time a user revisits the page.
- Caching your webpages- Your hosting service can do this for you at the server level, or you can use caching plugins.
7. Remove Unnecessary Plugins
Plugins reduce the cost of website development because they save developers a lot of development time. Additionally, plugins offer flexibility and can be very reliable.
Conversely, plugins reduce page speed and can be website vulnerabilities. WP White Security reports that plugins cause 54% of known WordPress vulnerabilities.
Plugins usually need additional JavaScript and CSS files to be loaded on a page, increasing the work a server needs to do in the shortest time possible. This slows down a page.
Therefore, it is important to regularly review your plugins to see if they are properly maintained and not outdated. Also, the more plugins used, the more bloated your site will be. Only include necessary ones.
Necessary plugins should also be reviewed and checked for code quality, files loaded by the plugin, and plugin size.
Optimize For Mobile Viewport First
Please note that you should optimize the mobile viewport first, followed by the desktop, because Google is using mobile-first indexing.
Mobile-first indexing means that Google will primarily use your webpage’s mobile version for ranking and indexing purposes. This is understandable because 63% of Google’s organic search traffic originates from mobile devices.
Interactivity: First Input Delay (FID)
Have you ever interacted with content on a website, only for the webpage to freeze and seem unresponsive?
This is an issue with the website’s interactivity, a Core Web Vital known as First Input Delay (FID).
FID is a metric that measures the delay when processing events like clicking a button that captures a site visitor’s first impression of a webpage.
Input delay occurs when a webpage is in the middle of a task, for example, loading an image, preventing it from running event listeners, thereby failing to respond to the input request.
Simply put, FID is the delay, measured in milliseconds, between the time you tap or click on something on a website and the time the browser responds and processes it.
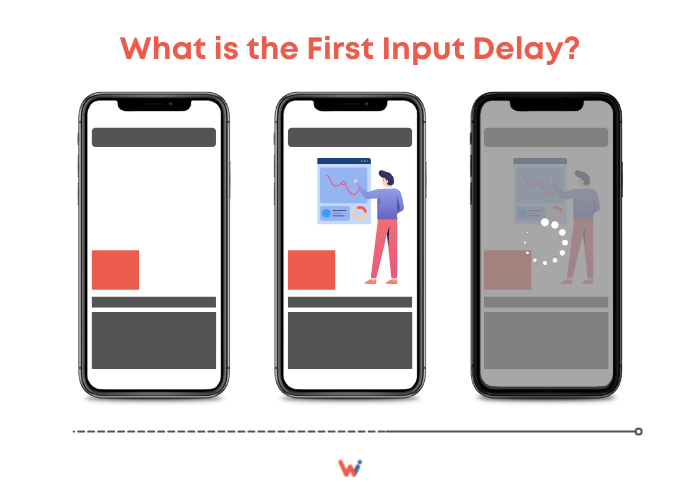
Source: Wishdesk
In technical terms, HTML can only be rendered after JavaScript and CSS have been loaded. This means that the more JavaScript your webpage has, the longer the input delay.
So, how do you measure FID?
How To Measure First Input Delay (FID)
FID can be measured in five main ways:
- Core web vitals report in search console
- Firebase performance monitoring
- Web-vitals JavaScript library
- Chrome user experience (UX) report
- Page speed insights tool
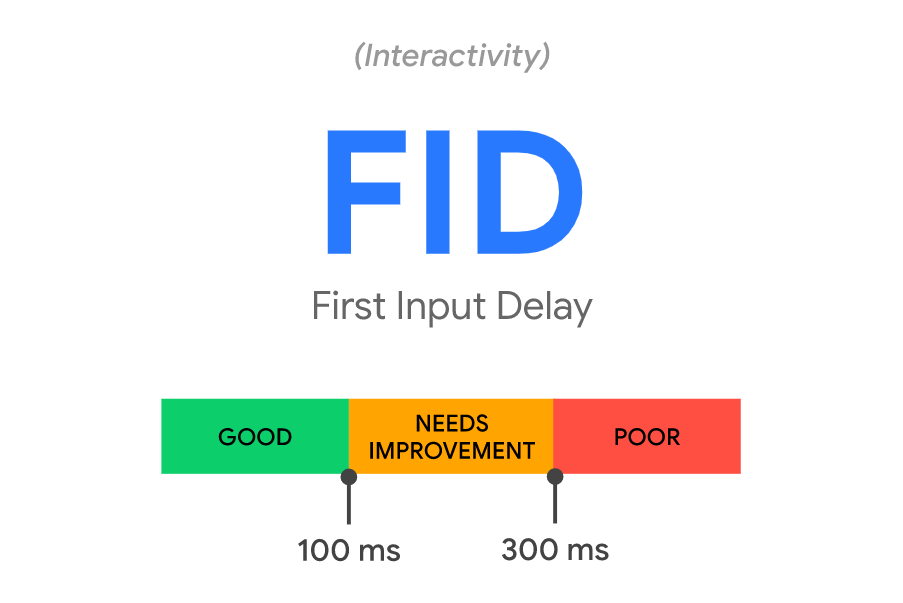
- To understand how your website has scored, you need to know FID scores and what they mean.
- Under 100 milliseconds= Good
- Between 100 and 300 milliseconds= Needs improvement
- Above 300 milliseconds=Poor
Source: Snigel
How did your website perform? Is there room for improvement?
Let’s look at a few ways of improving your FID.
How To Improve First Input Delay
Optimize Your JavaScript Code
JavaScript is the main culprit in input delays. These tasks don’t allow the browser to process the user input by blocking the browser’s main thread, normally for a long time.
The first step is to make sure that you use as little JavaScript as possible.
Then, you can optimize the remaining JavaScript code by minimizing how long it blocks the main thread.
How?
- Reduce the amount of data processing needed on the client-side by generating as much data as possible, statically, on the server-side.
- Reduce the main thread’s workload by delegating some of it to web workers, enabling some JavaScript code to run on the worker thread.
- Optimize internal linking.
- Only run needed polyfills. Polyfills allows developers to build websites with modern JavaScript while delivering all functionalities to older browsers that don’t support them. Unfortunately, while improving user experience, on the one hand, polyfills might be stifling UX on the other. So, minimize unused polyfills.
- Conduct a site audit and delete unused code.
- Prioritize loading of third-party code on-demand.
- Make sure that your tasks are under 50ms. Longer tasks can be broken into shorter, nonsimultaneous tasks.
- Use code-splitting. Once you do this, a user’s browser can download the entire app, navigating your website without the need for another HTTP request. Consequently, the browser won’t need to import or require any other files because they’ll all be in the bundle.
- Optimize for both mobile and desktop devices.
Don’t ignore FID
Always test your FID and optimize as much as possible. You shouldn’t ignore this because it’s important for Search Engine Optimization (SEO).
Total Blocking Time is FID’s lab proxy, accounting for 25% of your site’s Google Performance Score. This also plays a part in Google’s PageSpeed Insights tool, measuring page speed scores for mobile and desktop.
Stability: Cumulative Layout Shift (CLS)
Have you ever experienced sudden annoying changes on a webpage? For example, a link moving when your finger was about to land on it and tap, forcing you to tap on something else, maybe an ad? Worse still, canceling an order you were about to make, forcing you to start all over?
This usually happens without warning, and you end up interacting with the wrong element on a webpage!
Thankfully, Google also thinks that this is frustrating, and now, developers have to mind Cumulative Layout Shift (CLS) when developing websites.
CLS is a metric that measures visual stability.
Let’s look at what causes visual instability.
Causes of Cumulative Layout Shift (CLS) And How to Improve
Videos And Images That Lack Dimensions
Videos and images don’t maintain a responsive aspect ratio when they lack dimension specifications.
To solve this problem, and have responsive images, for example, use features such as or the HTML source attribute srcset, which will guide the browser on what images to choose.
Dynamic Sizing in Advertising Units
Advertising units are one of the biggest contributors to high CLS.
Although Google AdSense has invested in responsive ad units for some time, display advertising providers and related companies normally use ads with dynamic sizes. This technique allows more advertisers to compete for an impression, increasing competition and revenue at the cost of user experience.
How?
Dynamic ad units load with 0px height, expanding to the correct size after the ad bidding and loading have happened. This process takes a few seconds, which causes a shift of these elements on the webpage.
This problem multiplies when the ad unit is near the top of the page, showing an empty spot within the viewpoint before finally loading and pushing the rest of the page’s content down.
The result is a frustrated user and a high CLS score.
There are solutions!
- Have a wrapper around all your ad units and add a min-height value to it.
- Switch to a fast ad serving solution, which will load the ads as fast as possible and stabilize the page.
- Consider changing the loading order for the webpage’s elements.
- Reserve space specifically for the ad so that if it delays, other webpage elements remain in position.
- Since not all ads are responsive, you can use a placeholder for dynamic ads and set it to the largest ad size possible.
Invisible Text
Invisible text is also referred to as content inserted after the initial page load. This is content that is hidden when the page is first rendered but is subsequently displayed after the user takes action, for instance, by clicking a button.
Depending on how it’s done, invisible elements on a webpage can be displayed on the page until it has finished loading, then hidden. They can also disappear directly after being rendered, becoming almost unnoticeable.
These web development techniques result in layout shifts. It is best to avoid hidden elements on your page, including invisible text.
Flash of Invisible Text (FOIT) or Flash Of Unstyled Text (FOUT)
Sometimes, fonts don’t load correctly.
A fallback font is displayed by the browser before custom fonts are loaded (known as Flash of Unstyled Text (FOUT)) or rendering text is delayed because the browser is waiting for a font from a web server to be fully loaded (known as Flash of Invisible Text (FOIT).
To avoid this, consider using proper font display values such as fallback, swap, optional, auto, and block, among other custom fonts.
FOIT occurs as a result of loading delay. This means that you should set elements to load together when optimizing for page speed.
Animations That Cause Layout Shifts
Dynamic animations are a culprit here.
Similar to images, videos and ads, ensure that animations, motion graphics, and other similar content use consistent spatial and dimensional requirements. This applies to any other dynamic content, iframes, and embeds.
Actions Waiting For Network Response Before Updating Document Object Model (DOM) Elements
A slow server HHTP response leads to CLS, especially when using Content Distribution Networks (CDN). Loading of indented DOM elements will take a few milliseconds, causing a layout shift.
To solve this, either synchronize the load with other elements or build a space in DOM, for example, statically reserving space for ad slots.
CLS score ratings will help you understand your website’s visual stability.
CLS Score Ratings
Google has set standards for CLS ratings to provide a good user experience.
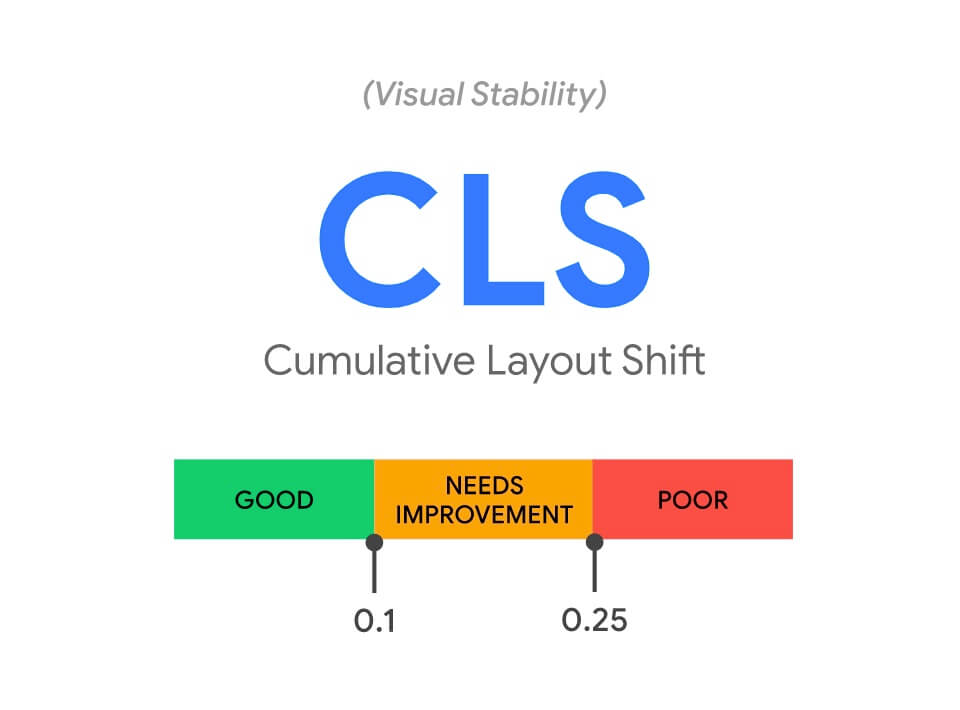
- CLS score less than 0.1 = Good
- CLS score of 0.1 and 0.25= Needs Improvement
- CLS Score above 0.25 = Poor
Source: Huckaby
There’s room for improvement, even when your website has scored less than 0.1.
How To Measure Cumulative Layout Shift (CLS)
This is how Google computes CLS:
Cumulative Layout Shift (CLS)= Impact Fraction X Distance Fraction
Impact fraction is the amount of space an unstable element takes up in a viewpoint area between two frames. The distance fraction measures the amount of space that the unstable element has moved from the original to the final position.
So, the higher the impact and distance fraction, the higher the CLS, and the poorer your website performs!
Fortunately, you don’t have to calculate CLS manually. A few tools you can use include:
- Google Search Console- Go to Google Search Console, click on the Core Web Vitals tab in the left sidebar, and open a report (check for both mobile and desktop to monitor your site’s performance on both types of devices), you’ll see a list of webpages with a low CLS.
- Google PageSpeed Insights- Post a URL on the Google PageSpeed Insights tool to see its CLS score. This method reports the full web page’s score on web vitals, including FID and LCP.
To measure CLS, visit a webpage or use Google Chrome Developer tools.
Conclusion
Understanding core web vitals and optimizing your website for them will significantly improve user experience and search engine rankings.
Google offers free tools such as Google Search Console, Google PageSpeed Insights, Chrome User Experience Report, and Chrome DevTools to help measure and track your Core Web Vitals.
Use these tools to ensure that your website is enhanced for optimal loading, interactivity, and visual stability. Otherwise, it will not rank in the top search engine results.

